Product mix
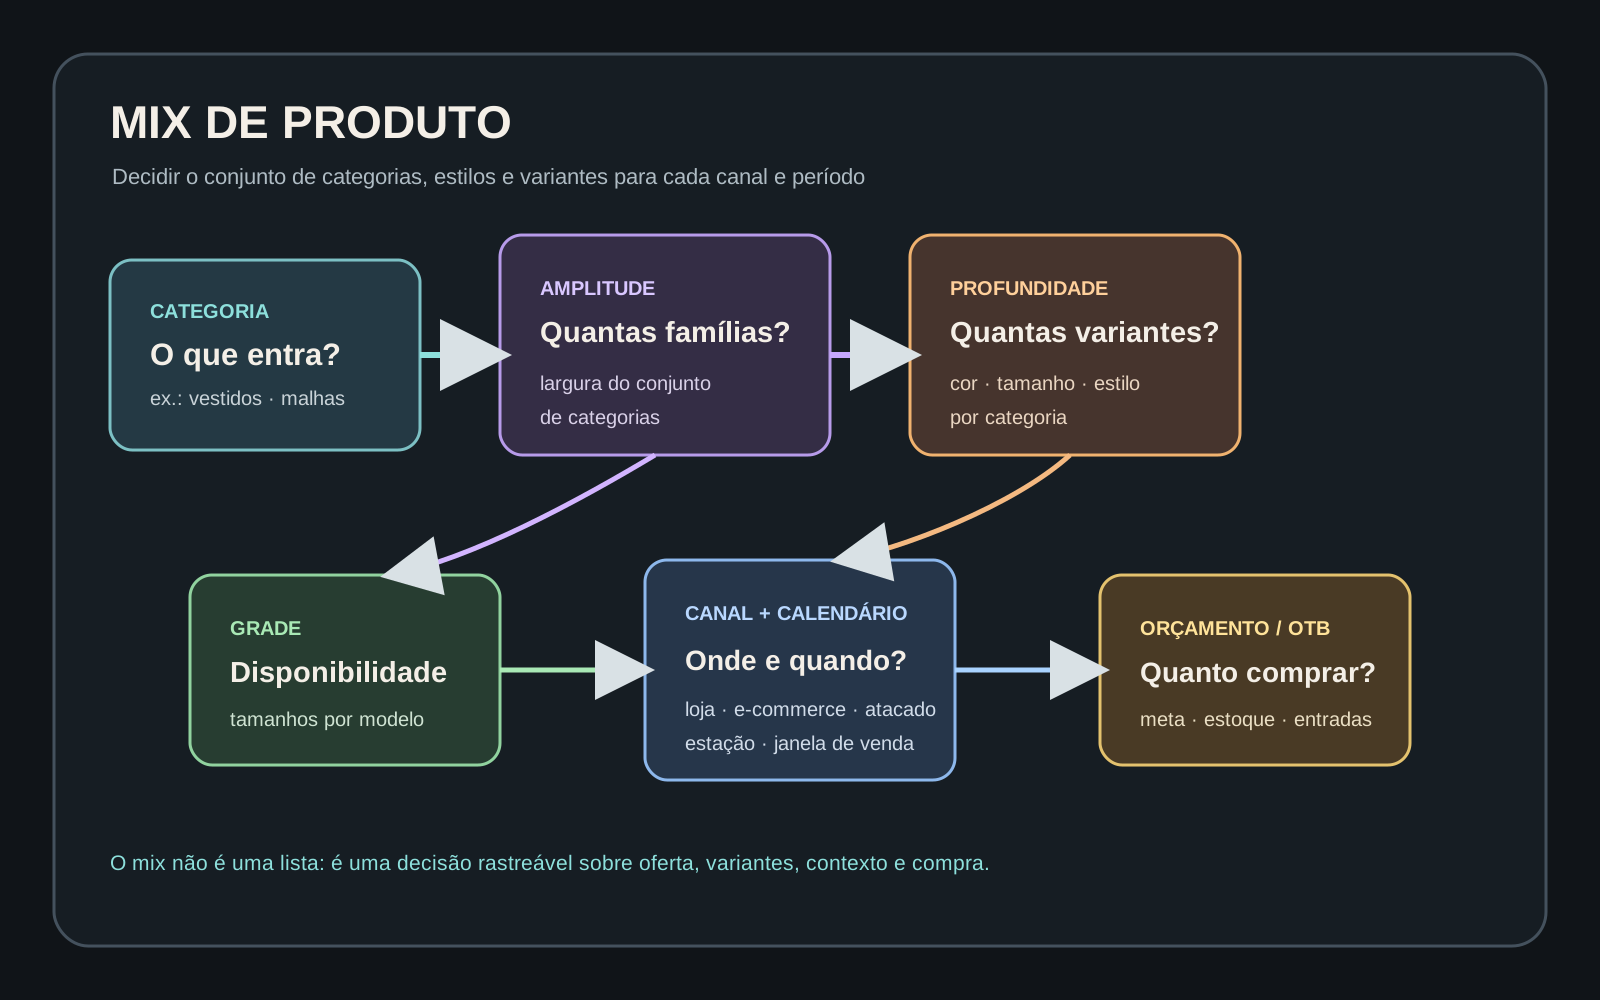
A product mix is the decision about which categories, styles, and variants a fashion operation offers in each channel and period. The process separates breadth, depth, size range, demand, and buying so a collection intention becomes a checkable offer.
On this page
What is Product mix?
A product mix is the planned composition of an offer: which categories, styles, and variants enter, for which channel, and in which period. In fashion retail, assortment planning organizes seasonal styles and allocates them to stores and other sales channels. Therefore, a collection map should not be confused with the commercial decision that turns a collection into an offer.
The decision unit must be explicit. Category answers “which family enters?”; style answers “which concrete proposition?”; SKU or variant answers “in which color and size will it be offered?” A merchandise plan works at category level, while a fashion assortment goes down to products and styles. This distinction keeps a category budget from being mistaken for a final product list.
How do breadth and depth change the mix?
Breadth is the variety of products sold; depth is the number of variations, such as sizes and colors, available for each product. In decision terms, breadth opens more families or propositions, while depth concentrates options within each family. Assortment depth refers to the variation offered within it; a retail example combines brands, colors, and sizes for a category.
The choice between broadening and deepening should be made by scope, not abstract preference. Record the category, style, colors, size range, channel, and selling window on the same plan row. A category with many propositions may need fewer variants per proposition; a central proposition may justify more colors or sizes. This is a process-design rule, not a universal promise of performance.
The mix is easier to read when the line plan shows the set and the product record shows the variant. Do not count “styles” and “colors” as if they were the same thing: breadth answers the width of the set; depth answers the choice within each item.
How do you connect the mix to demand and buying?
A forecast uses historical information as an input to demand planning. It can feed a mix hypothesis, but it does not by itself decide which styles will be developed. To review the hypothesis, compare each product or category’s sell-through rate at the same point in the previous year; read the signal with the declared period, channel, and category.
Budget enters as both constraint and buying mechanism. An open-to-buy calculation uses sales forecasts, opening stock levels, and desired closing stock levels. Its result can be separated into departments or categories to guide orders and arrival intervals. OTB therefore answers how much can still be bought; the mix answers what occupies that space.
Stock visibility covers timing, quantity, and storage decisions. Record committed receipts, units available, and the reading date before concluding that a category should grow or shrink. A sales signal without its context can change the mix for the wrong reason.
How should a mix be reviewed without losing context?
Use a table by channel and period with category, style, variant, planned quantity, committed buying, available stock, and the reading indicator. Mark demand hypothesis, product decision, and buying commitment separately. The team can then review the offer architecture first, depth second, and buying balance last.
The mix should also connect to price architecture, demand planning, and sell-through. These relationships do not replace period data; they make clear where the decision can be explained, revised, or discontinued. The process is complete when another person can reconstruct why a category received that breadth and depth, rather than seeing only the total bought.
Verified facts
- In fashion retail, assortment planning organizes seasonal styles and allocates them to each store and other sales channels.
Source: oracle.com ↗ - A merchandise plan works at category level, while a fashion assortment goes down to products and styles.
Source: oracle.com ↗ - Assortment depth refers to the variation offered within it; one example includes brands, colors, and sizes for a category.
Source: oracle.com ↗ - Breadth is the variety of products sold, while depth is the number of variations, such as sizes and colors, available for each product.
Source: shopify.com ↗ - Historical review can use the sell-through rate of each product or category at the same point in the previous year.
Source: shopify.com ↗ - An OTB calculation uses sales forecasts, opening stock levels, and desired closing stock levels.
Source: retaildogma.com ↗ - An OTB process can separate its result into departments or categories to guide orders and arrival intervals.
Source: retaildogma.com ↗ - A forecast uses historical information as an input to demand planning.
Source: ibm.com ↗ - Stock visibility covers timing, quantity, and storage decisions.
Source: ibm.com ↗
Related entries
Collection map
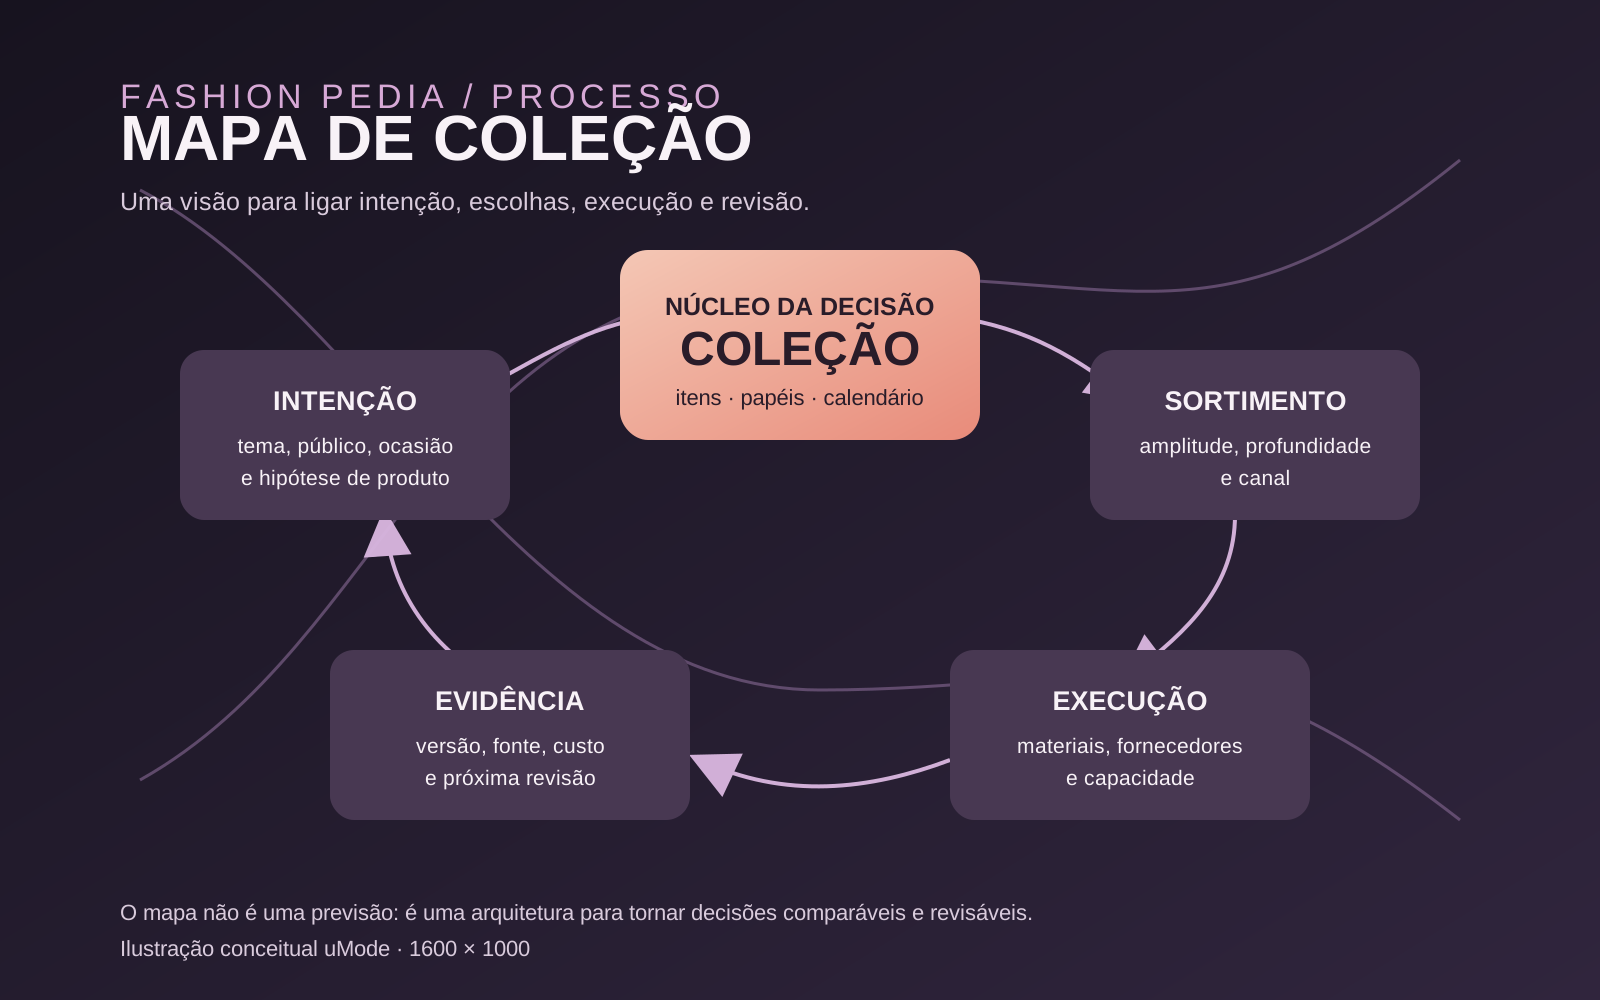
A collection map is a process view that makes the relationships between intent, items, assortment, execution, and review explicit. It organizes hypotheses and decisions for comparison without confusing planning with a guaranteed forecast or automatic purchasing authority.
Collection line plan
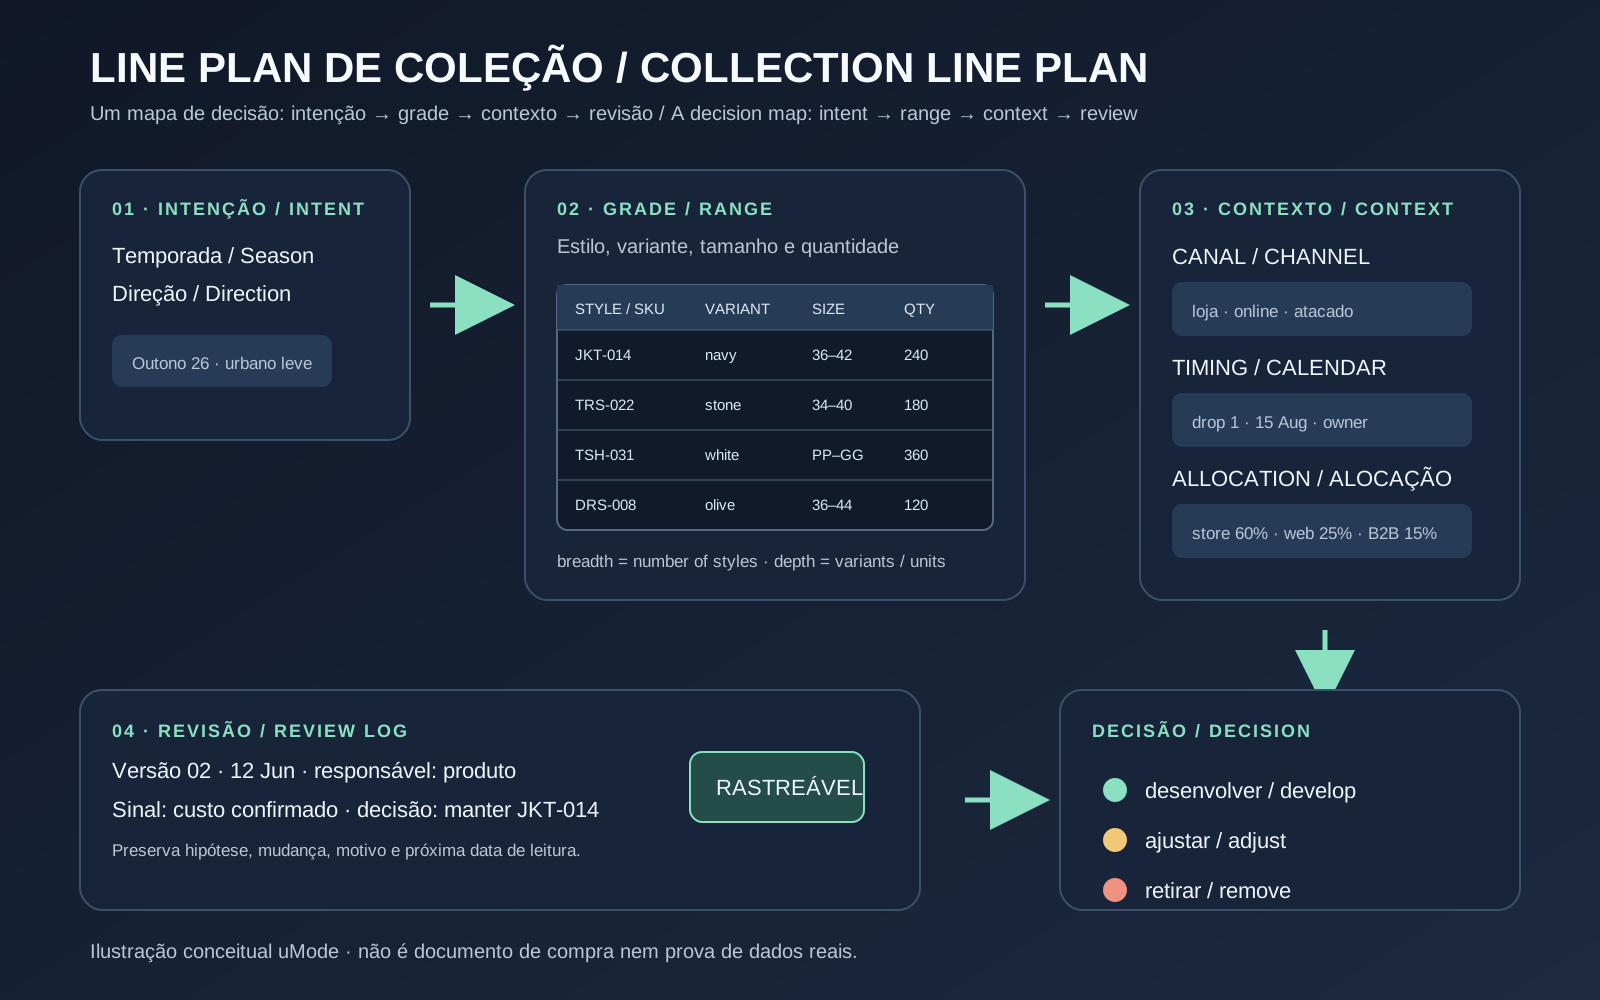
A collection line plan is the operating record that turns collection direction into a grid of styles, variants, sizes, channels, quantities and decision milestones. It defines what is planned for development or buying without replacing a tech pack, budget, forecast or product validation.
Size grading
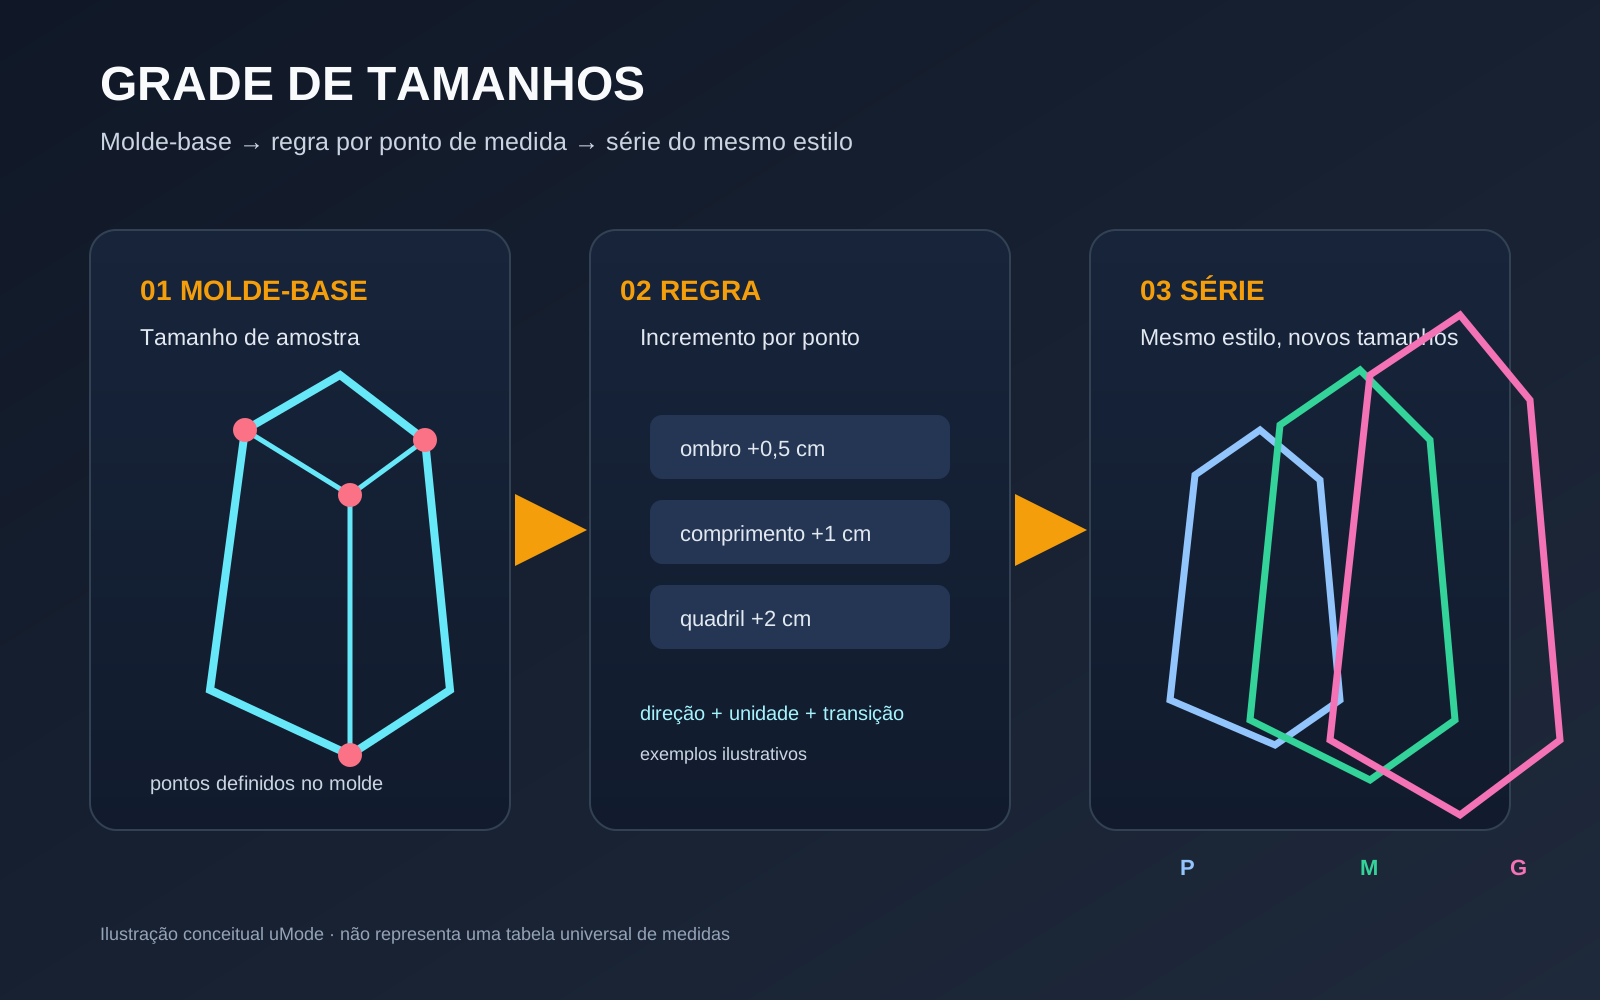
Size grading is the process of turning base-size or sample-size patterns into additional sizes by using a specification sheet or grading increments. A rule changes defined points on the pattern to form a size range for the same style; it does not replace patternmaking or create a new shape.
Demand planning in fashion
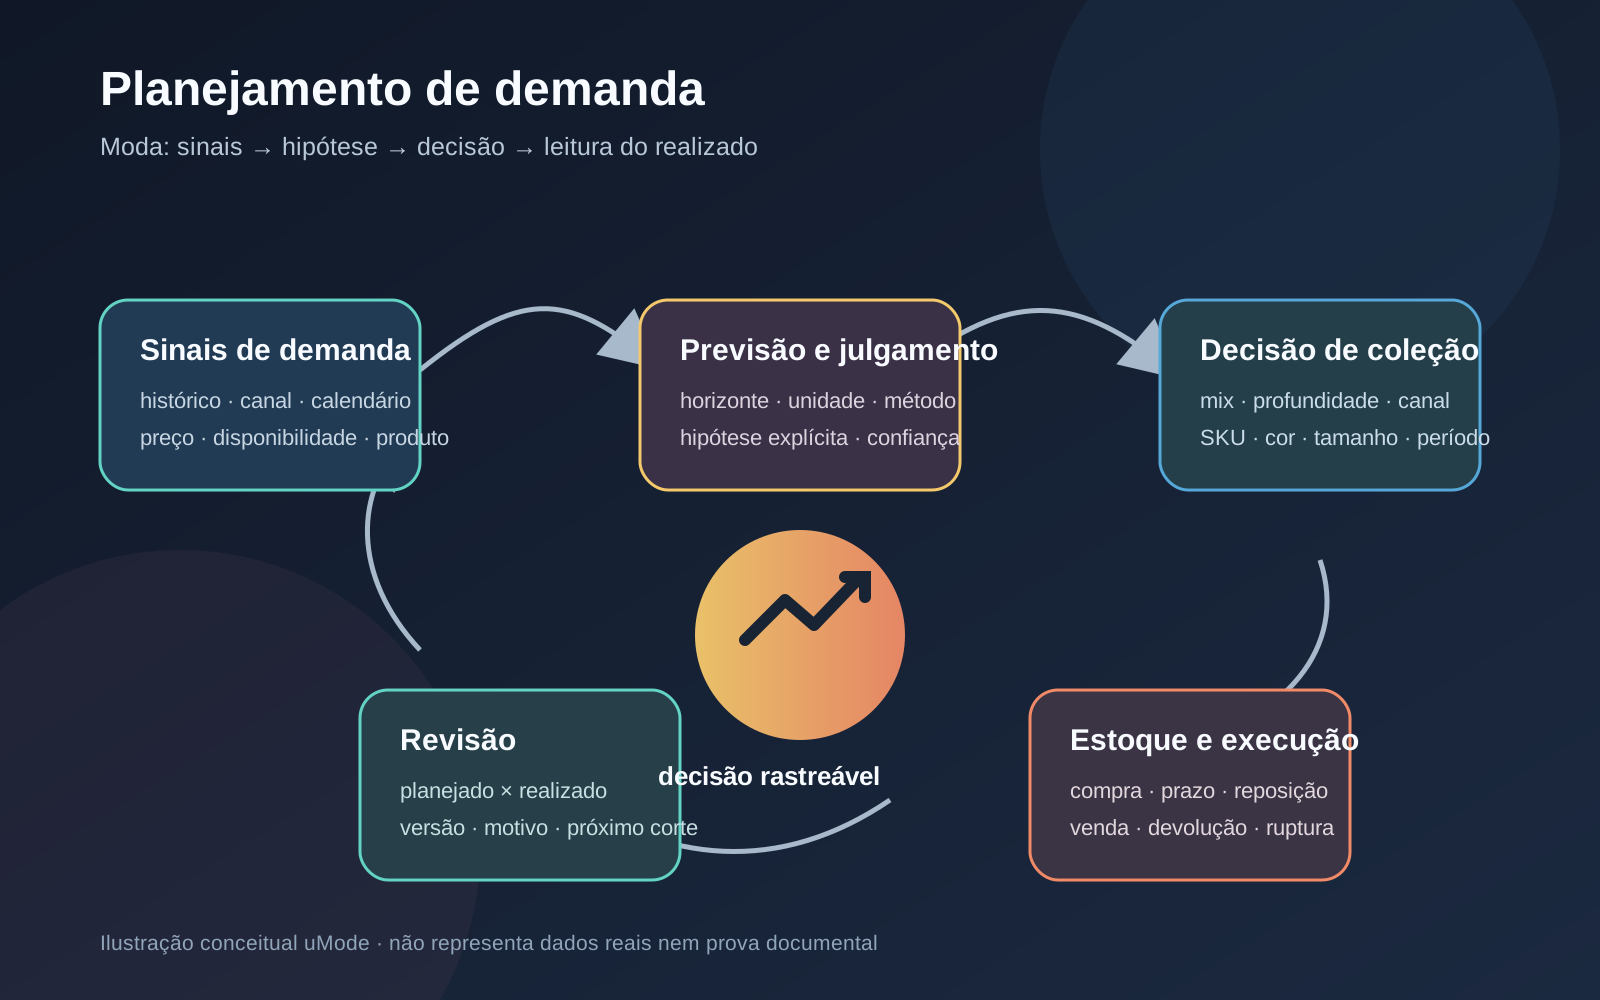
Demand planning in fashion turns demand signals, history, calendar context and judgement into explicit decisions about assortment, volume, channel and review. It combines forecasting with governance: every hypothesis needs a horizon, unit, owner and rule for revision when the collection or market changes.
Open to buy in fashion retail
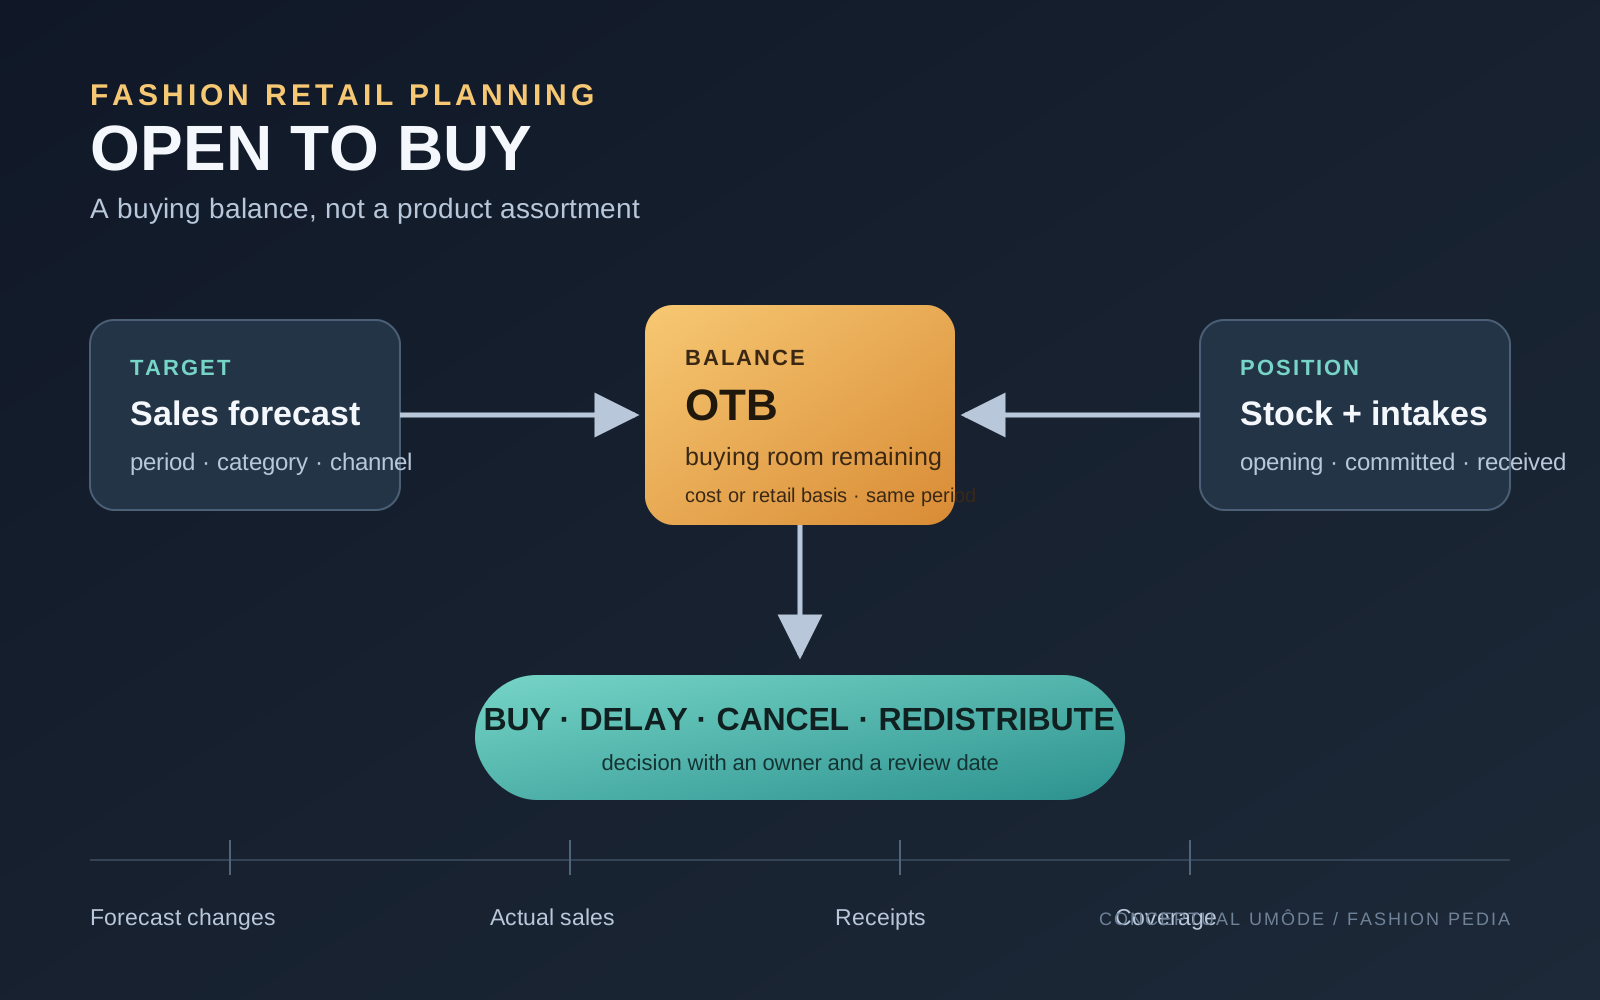
Open to buy in fashion retail. Open to buy (OTB) is a planning process that calculates how much inventory a retailer needs to buy to reach a sales target, using forecast sales, opening stock and desired closing stock. In fashion retail, the balance should be read by period, category, channel and stock cover; it guides buying without replacing assortment decisions.
Sell-through in fashion retail
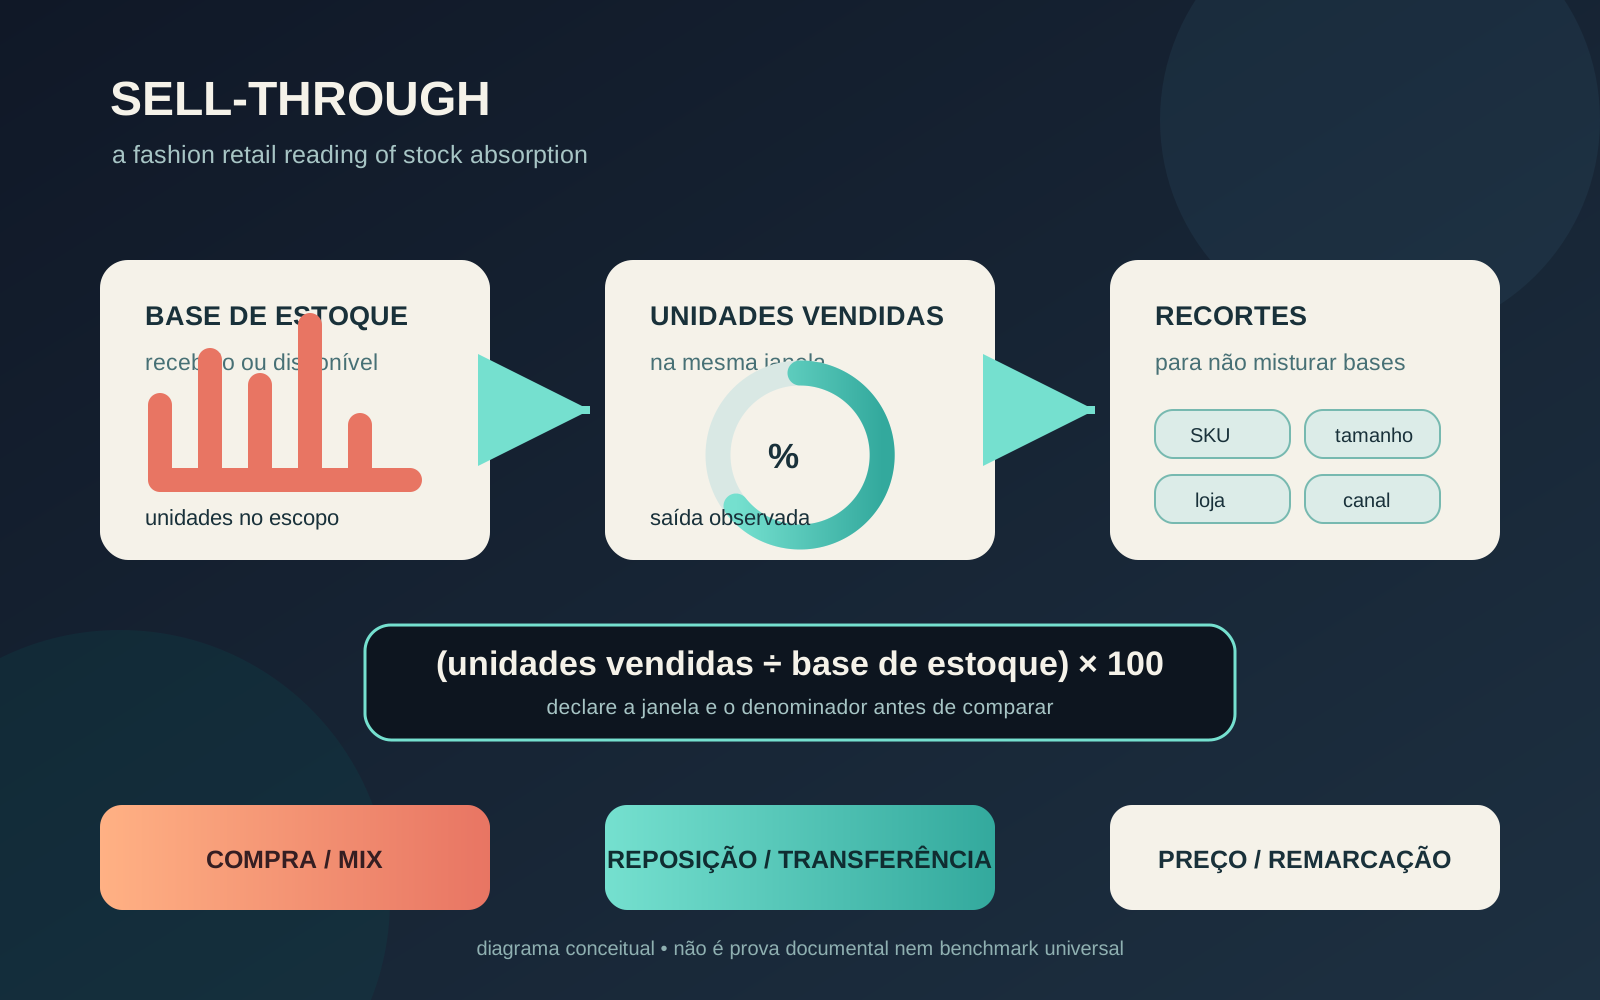
Sell-through in fashion retail. Sell-through is the percentage of units sold from inventory received or made available within a defined window. In fashion retail, the metric becomes useful when it is cut by style, color, size, store, channel, and product life cycle, with the denominator stated before it informs buying, replenishment, or markdown decisions.
Fashion price architecture
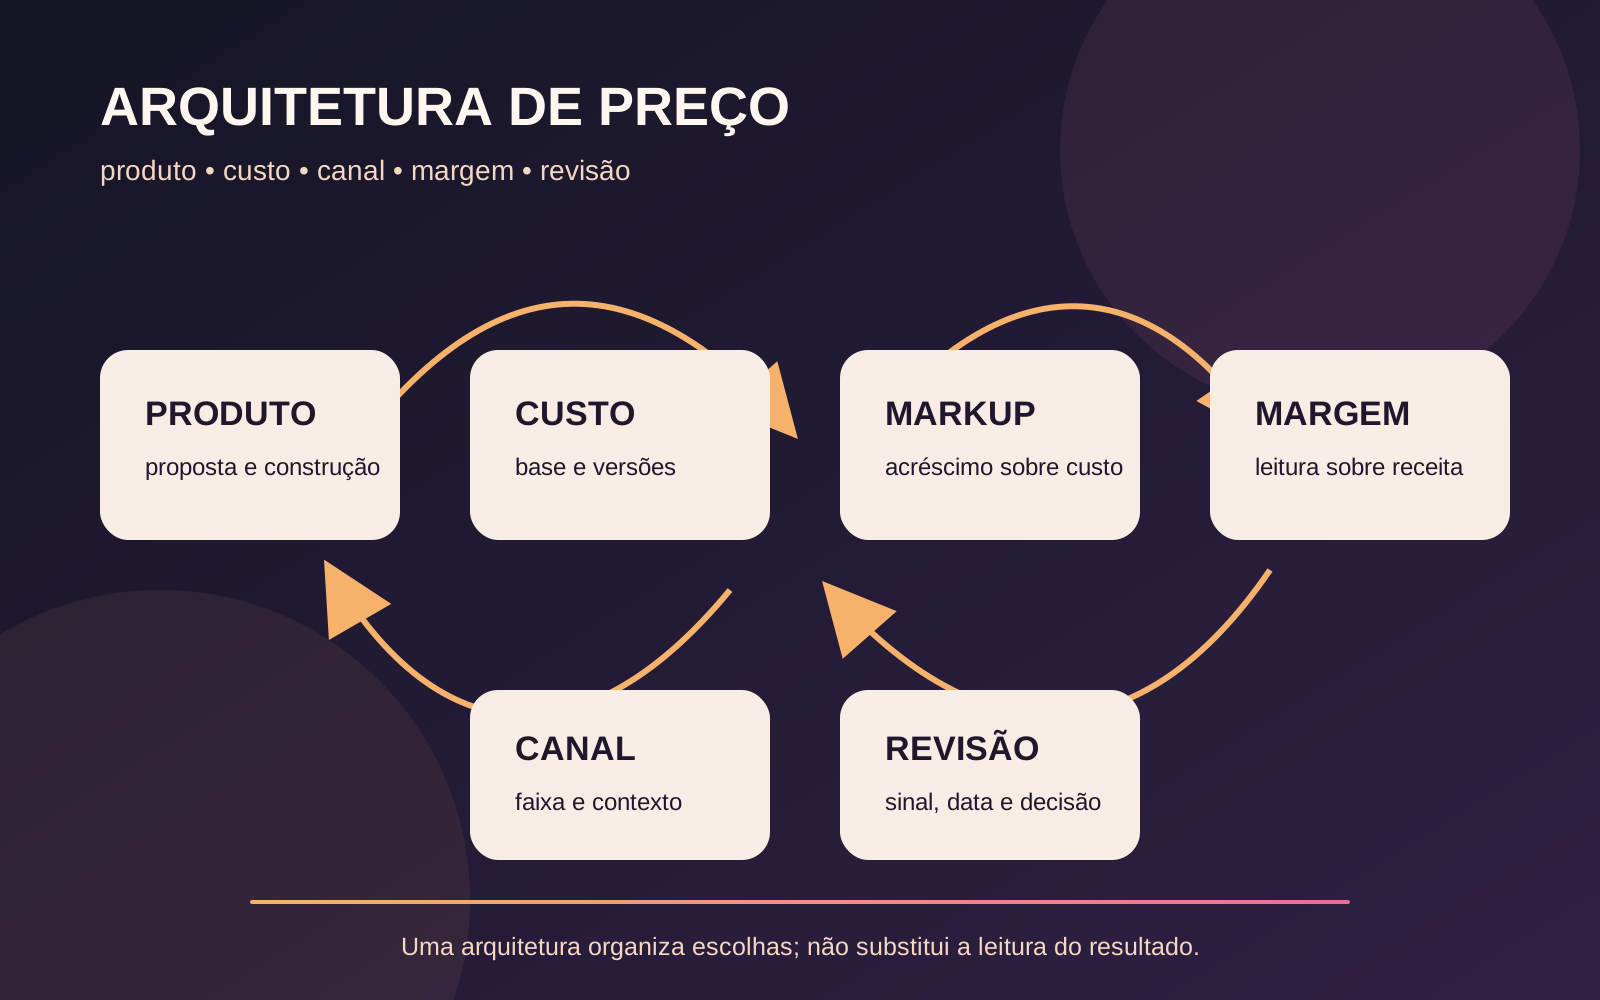
Fashion price architecture is the process of organizing costs, markup, margin, channels, and price bands so a collection intention can become comparable decisions. It connects product development with commercial review without treating one percentage as proof of profitability.
Sources
Want to apply this to your operation?