Demand planning in fashion
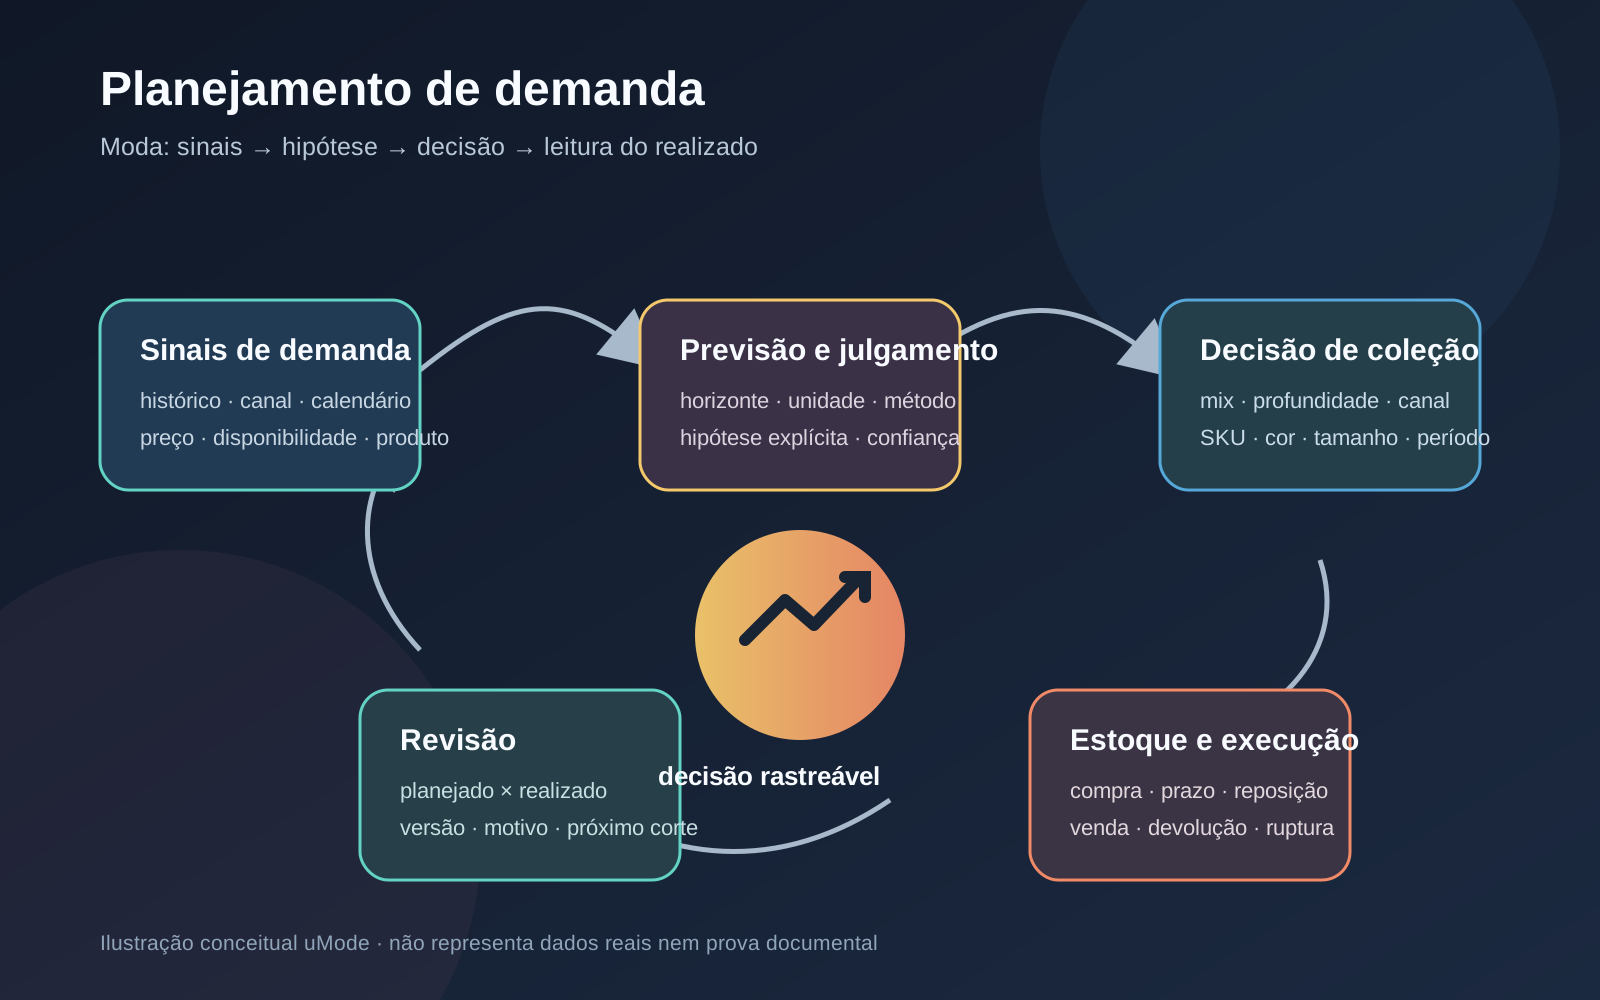
Demand planning in fashion turns demand signals, history, calendar context and judgement into explicit decisions about assortment, volume, channel and review. It combines forecasting with governance: every hypothesis needs a horizon, unit, owner and rule for revision when the collection or market changes.
On this page
What is Demand planning in fashion?
Demand planning in fashion is the process of turning demand signals into verifiable decisions for a collection, line, channel or selling window. A forecast is one input; the plan must also state what will be decided, at which unit—style, colour, size, channel or period—and when it will be reviewed. A number is therefore treated as a hypothesis that can be compared with what happened, not as a promise.
The starting point may combine sales history, orders, calendar context, price, availability and product reading. A collection map should separate creative intent from quantitative commitment. A line plan describes assortment architecture; demand planning tests whether the proposed variety and depth fit the horizon, channel and replenishment capacity.
How should the forecast and decision be structured?
A useful structure begins by defining the horizon, granularity, unit and source. It then separates observed data, hypothesis, manual adjustment and commitment. For each product-and-channel combination, record the planned value, cut-off date, owner and signal that would justify revision. This order prevents a price, exposure, calendar or availability change from being mistaken for a spontaneous change in preference.
When enough history exists, the team can test quantitative methods and reserve judgement for hypotheses that the data cannot capture. For new products or radical style changes, judgement should not disappear: it should be explicit, attributed to an owner and compared with later signals. The study on visual fashion-style forecasting offers a fashion-specific clue: visual attributes can add information alongside text and metadata, but an image is not a guarantee of sales.
Accuracy must be read outside the sample used to fit the model. Therefore, sell-out should not automatically be mixed with orders, invoicing, returns or available stock. If the series is split into training and test data, preserve the evaluation horizon and unit. Strong historical fit alone does not prove usefulness for the next collection.
How does the process apply to collections and inventory?
In practice, planning follows decisions at several levels. At collection level, use product mix to make roles and families explicit. At SKU level, record colour, size, channel and period. At the operational hand-off, compare the hypothesis with size grading, purchasing, supplier lead time and inventory replenishment. If the reading is aggregated, document how items were summed; otherwise, a strong family result can hide a stockout in one size or colour.
Seasonality deserves its own treatment. A series can contain trend-cycle, seasonal and remainder components, so ask whether a peak comes from a recurring calendar effect, promotion, launch or exceptional event. The team may use inventory turnover as a complementary reading, but it should not replace forecasting: turnover describes a different operational relationship from expected demand.
What are the limits, and how should the plan be revised?
Demand planning does not remove uncertainty or prove causation. Short history, a new product, stockouts, channel changes and delayed data reduce confidence. A forecast with future-unknown predictors also depends on assumed values or separate models; record those assumptions and their expiry date.
Revision should preserve the previous version, the reason for change and the decision taken. If the result is weak, ask whether the cause was forecast error, a deliberate change, delay, lack of stock or a price change. If the result is strong, do not treat it as proof that the original hypothesis was correct. Learning comes from comparing hypothesis, evidence, execution and consequence at the same unit of analysis.
The process matters because it connects design, planning, buying, sales and operations without erasing the differences between those functions. With sell-in, the team observes commercial inflow; with sell-out, it follows outflow; with collection map and line plan, it relates numbers to the shape of the offer. This network helps decide what to keep, test, delay or remove while keeping the hypothesis and confidence limit visible.
Verified facts
- Historical demand data is one input used to anticipate what customers may request in the future.
Source: ibm.com ↗ - Demand forecasting can support inventory-level management and data-driven decisions.
Source: ibm.com ↗ - Accuracy assessment requires observing model performance on new data that was not used for fitting.
Source: otexts.com ↗ - It is common to separate data into training data, used to estimate parameters, and test data, used to evaluate accuracy.
Source: otexts.com ↗ - A model that fits the training data well will not necessarily produce good forecasts.
Source: otexts.com ↗ - A time series can be analysed through trend-cycle, seasonal and remainder components.
Source: otexts.com ↗ - Judgmental forecasting is an option when historical data are absent, a new product is launched or market conditions are entirely new.
Source: otexts.com ↗ - Judgmental forecast quality can improve with domain knowledge and more timely information.
Source: otexts.com ↗ - In regression models, predictors that are unknown in the future must be modelled separately or assigned assumed future values.
Source: otexts.com ↗ - An academic fashion study found that visual analysis of products added value when forecasting the future popularity of styles.
Source: arxiv.org ↗
Related entries
Collection map
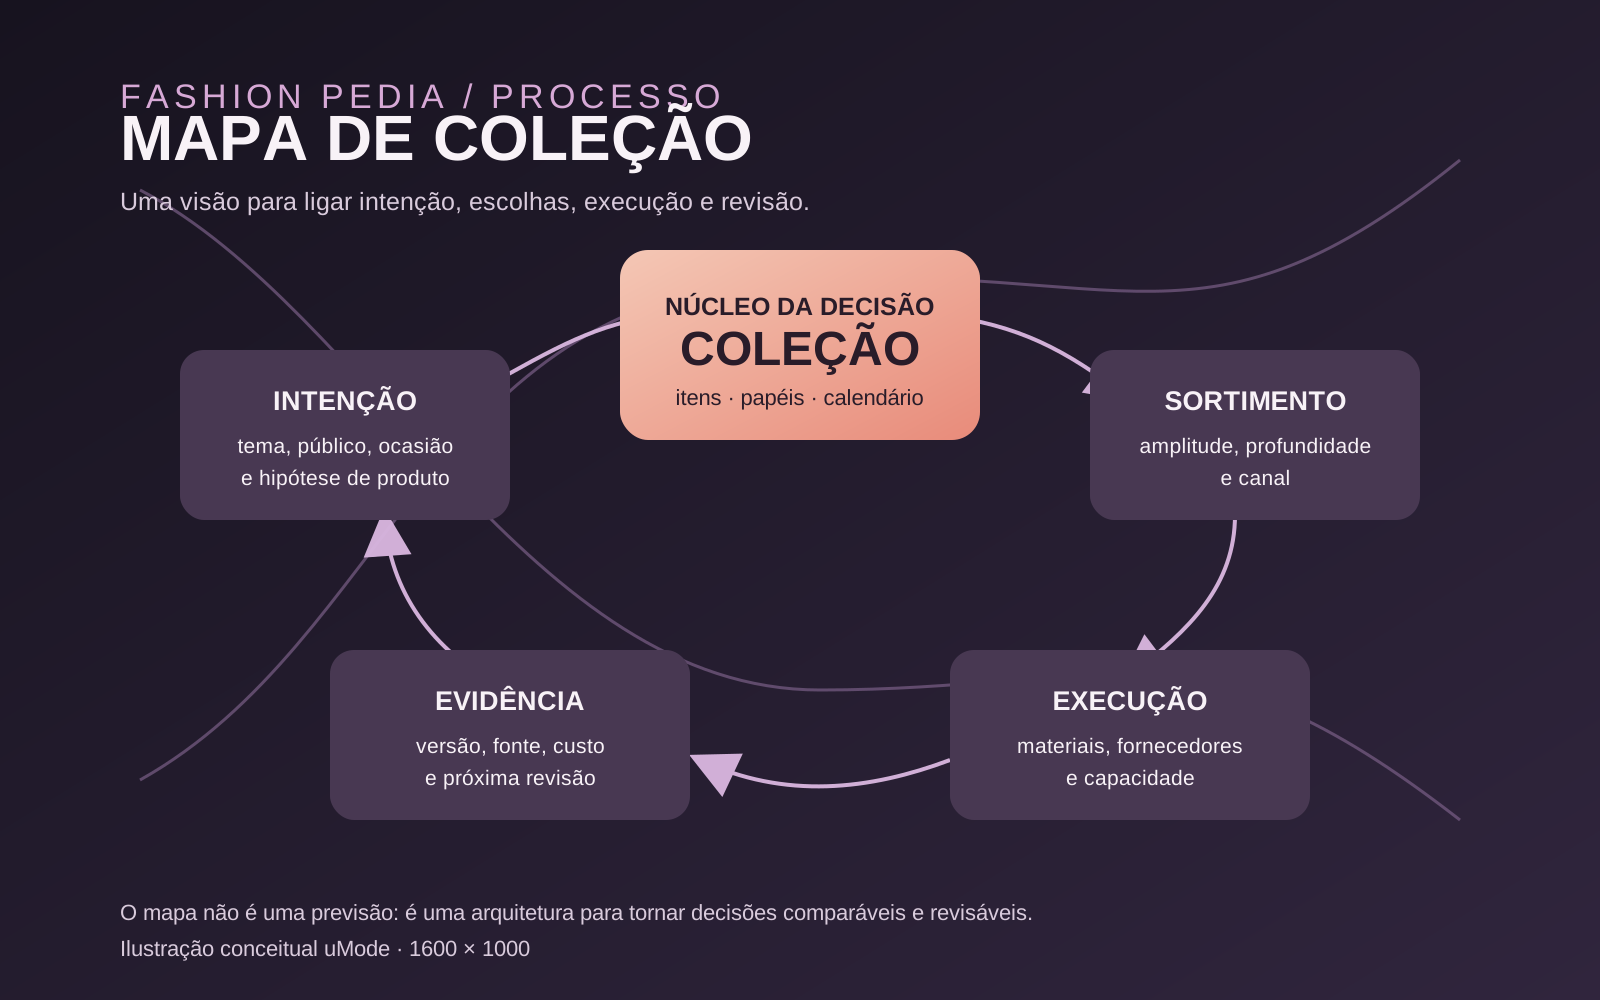
A collection map is a process view that makes the relationships between intent, items, assortment, execution, and review explicit. It organizes hypotheses and decisions for comparison without confusing planning with a guaranteed forecast or automatic purchasing authority.
Collection line plan
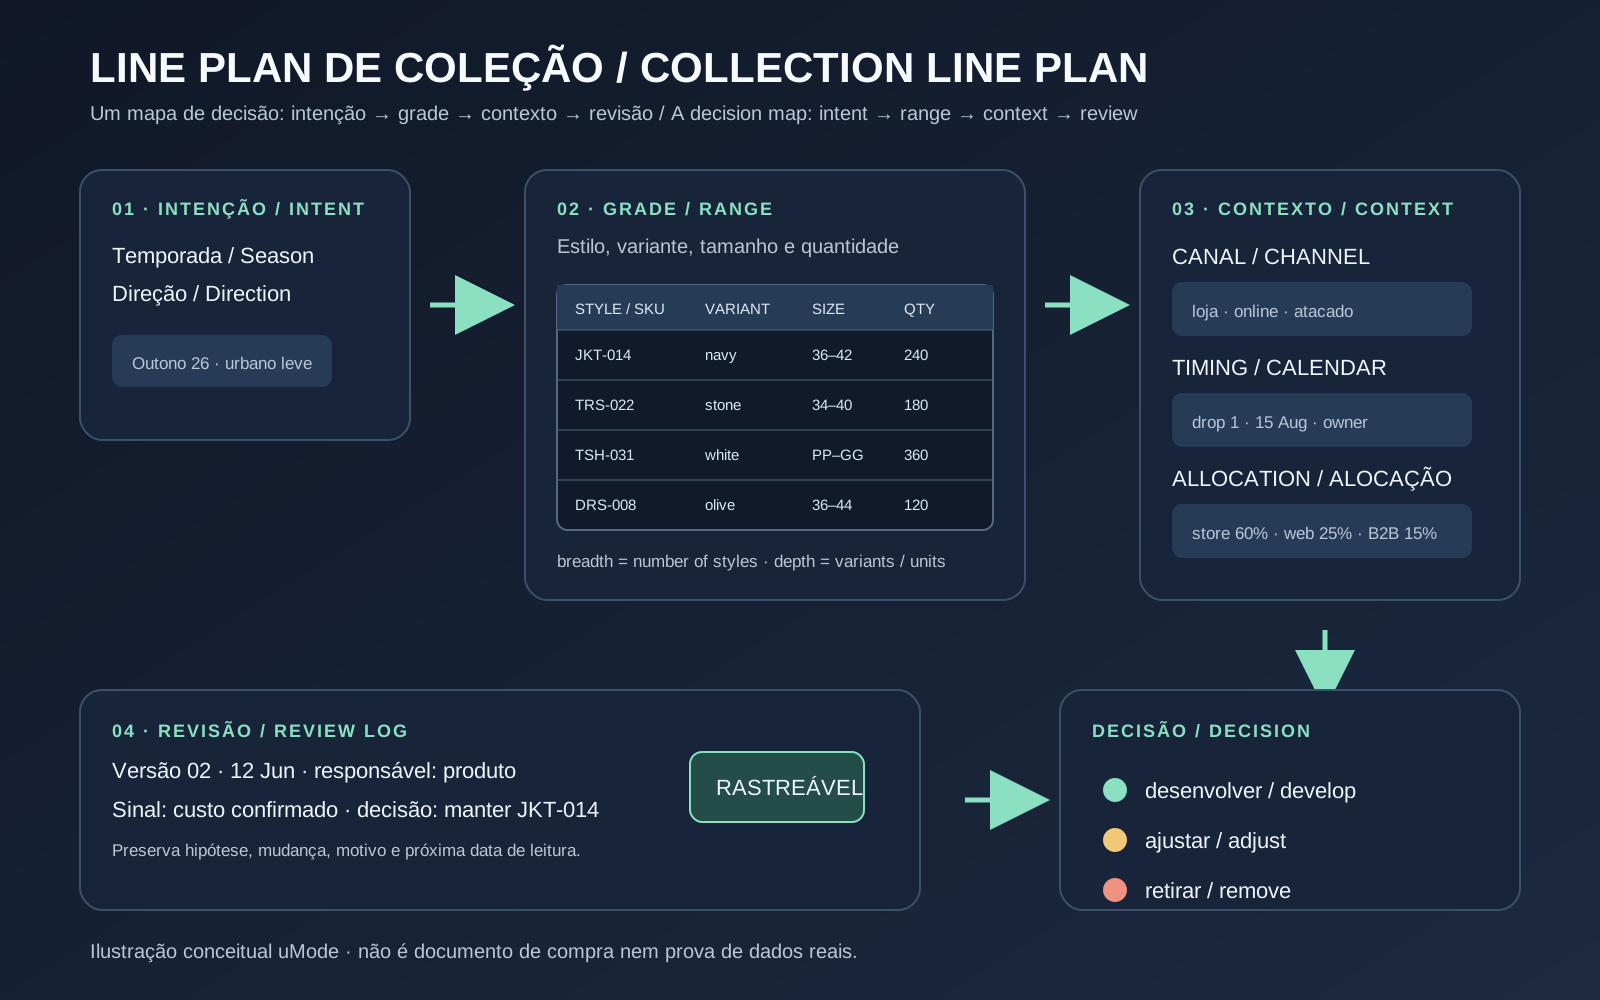
A collection line plan is the operating record that turns collection direction into a grid of styles, variants, sizes, channels, quantities and decision milestones. It defines what is planned for development or buying without replacing a tech pack, budget, forecast or product validation.
Product mix
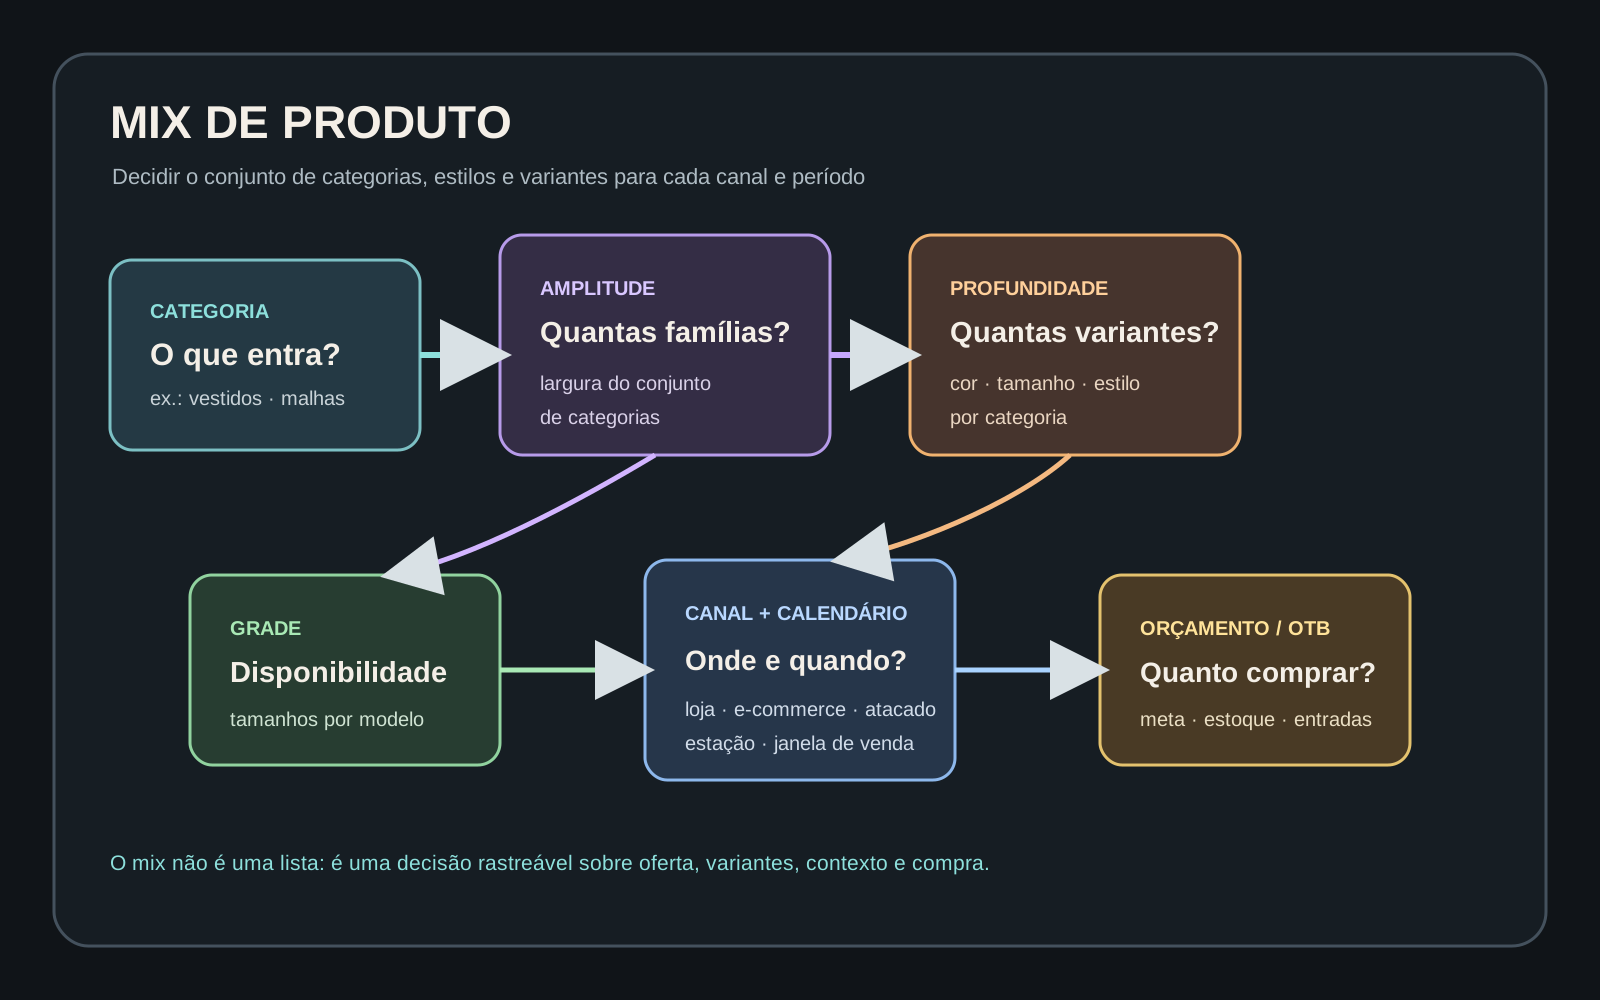
A product mix is the decision about which categories, styles, and variants a fashion operation offers in each channel and period. The process separates breadth, depth, size range, demand, and buying so a collection intention becomes a checkable offer.
Size grading
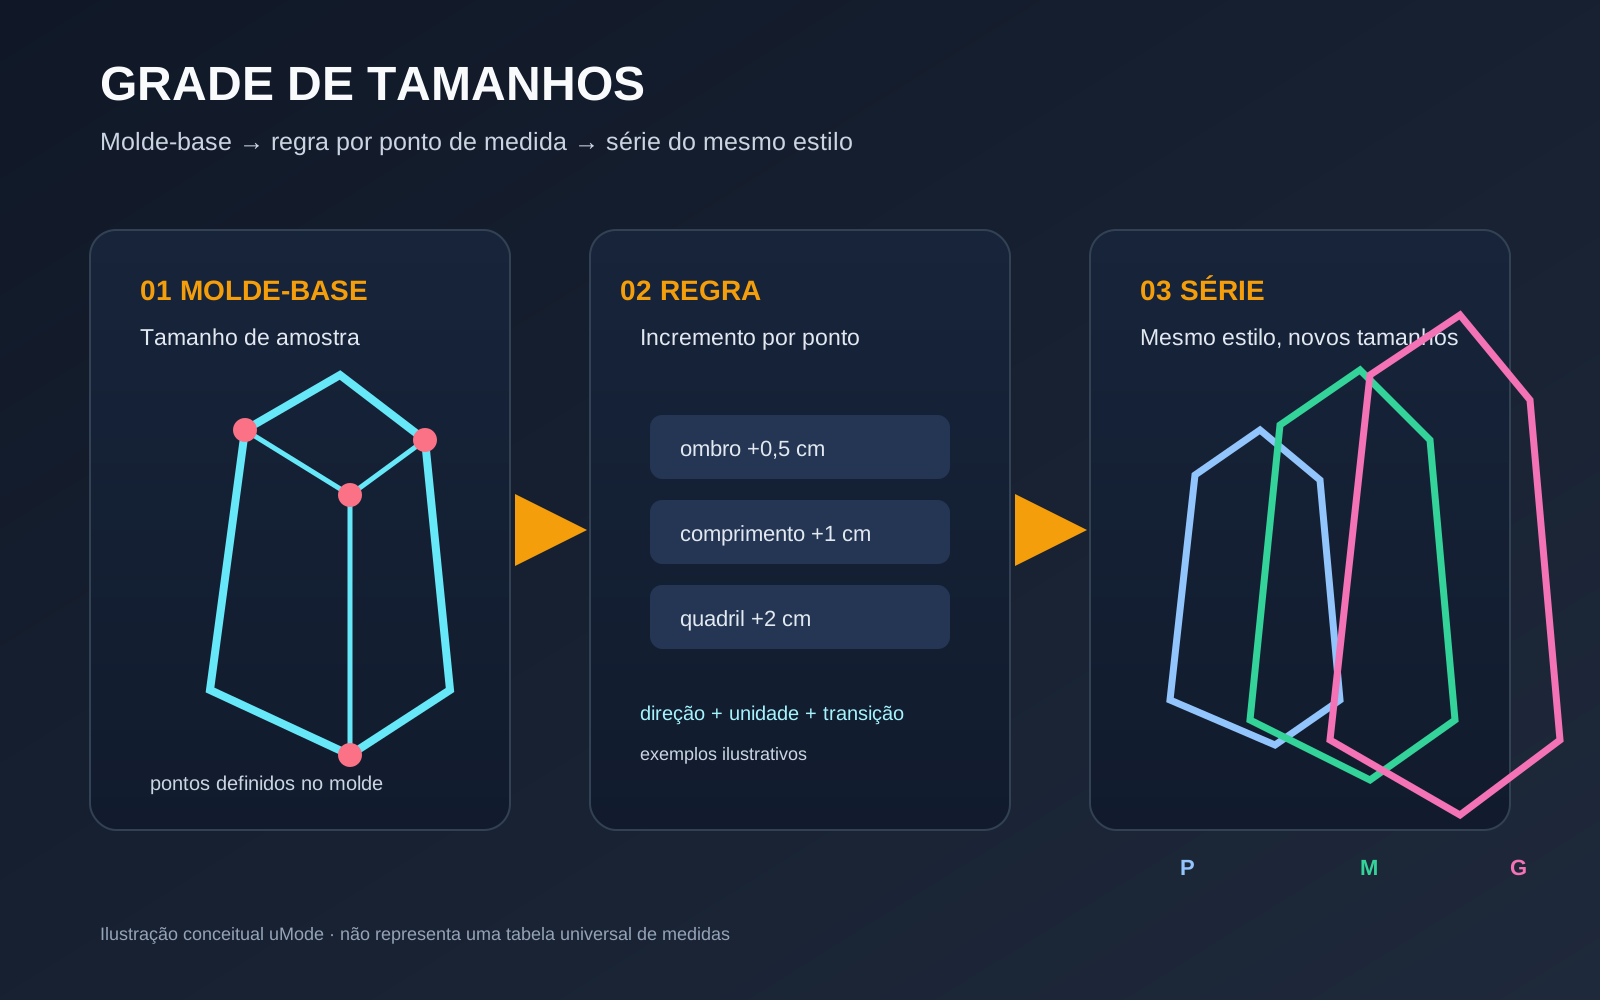
Size grading is the process of turning base-size or sample-size patterns into additional sizes by using a specification sheet or grading increments. A rule changes defined points on the pattern to form a size range for the same style; it does not replace patternmaking or create a new shape.
Inventory replenishment
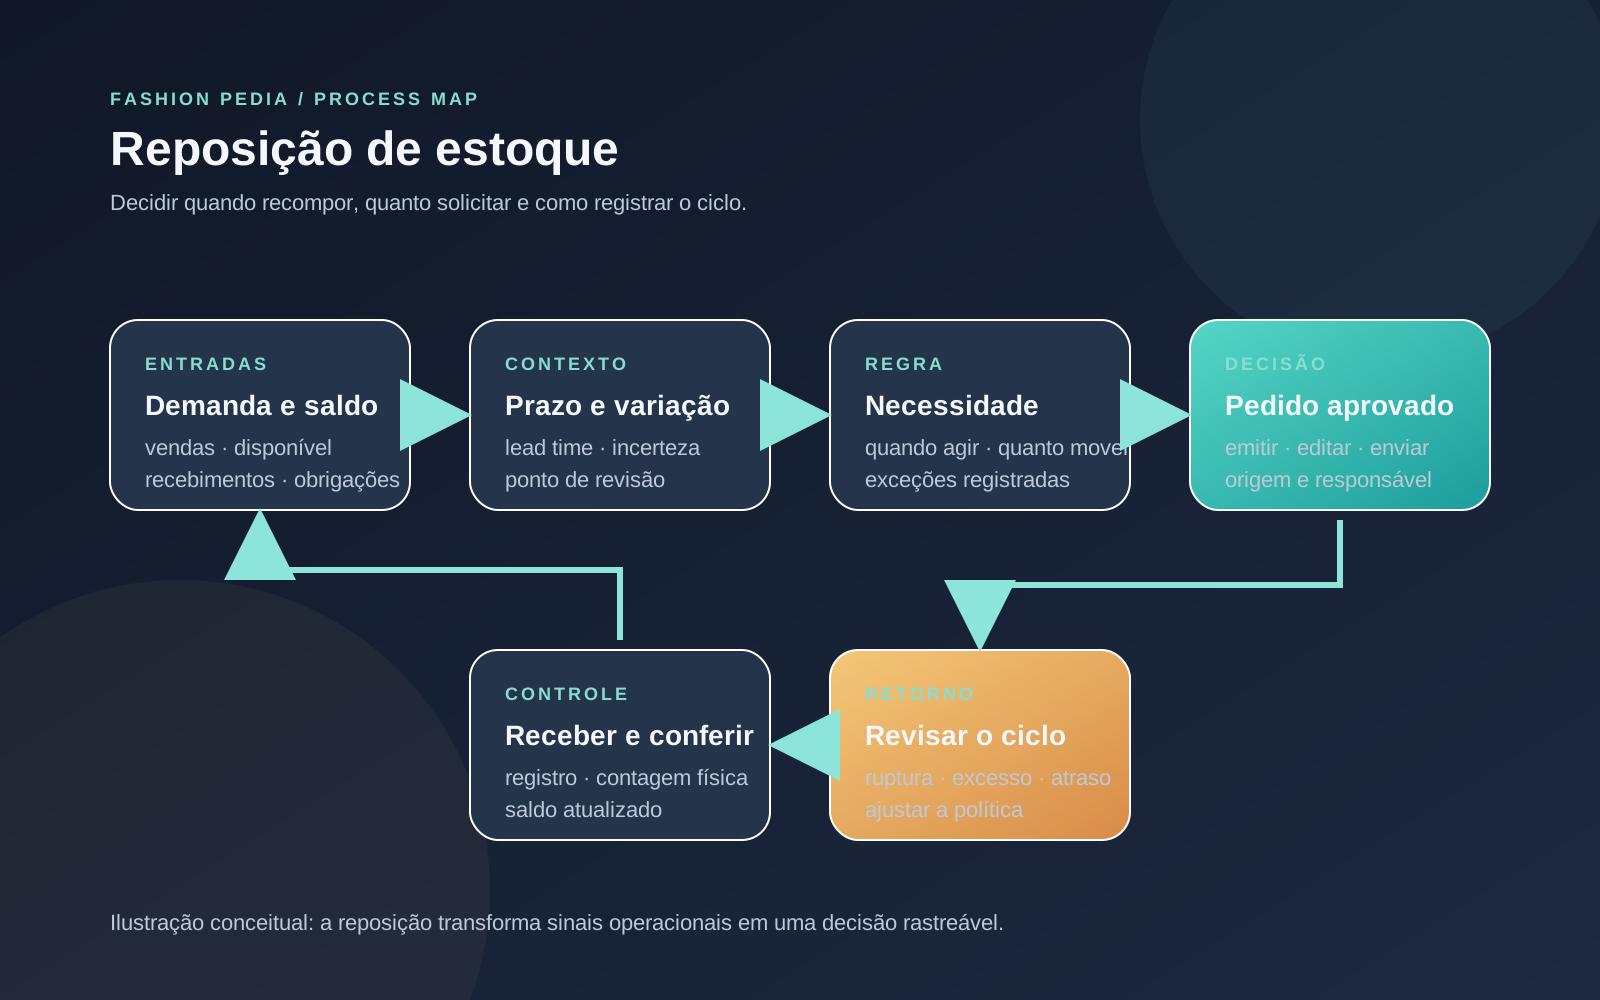
Inventory replenishment is the process of deciding when to restore an item's availability and how much to request for a future need. The decision combines recorded stock, demand, expected receipts, obligations, purchasing lead time and demand variation; the order must then be approved, received and recorded.
Inventory turnover
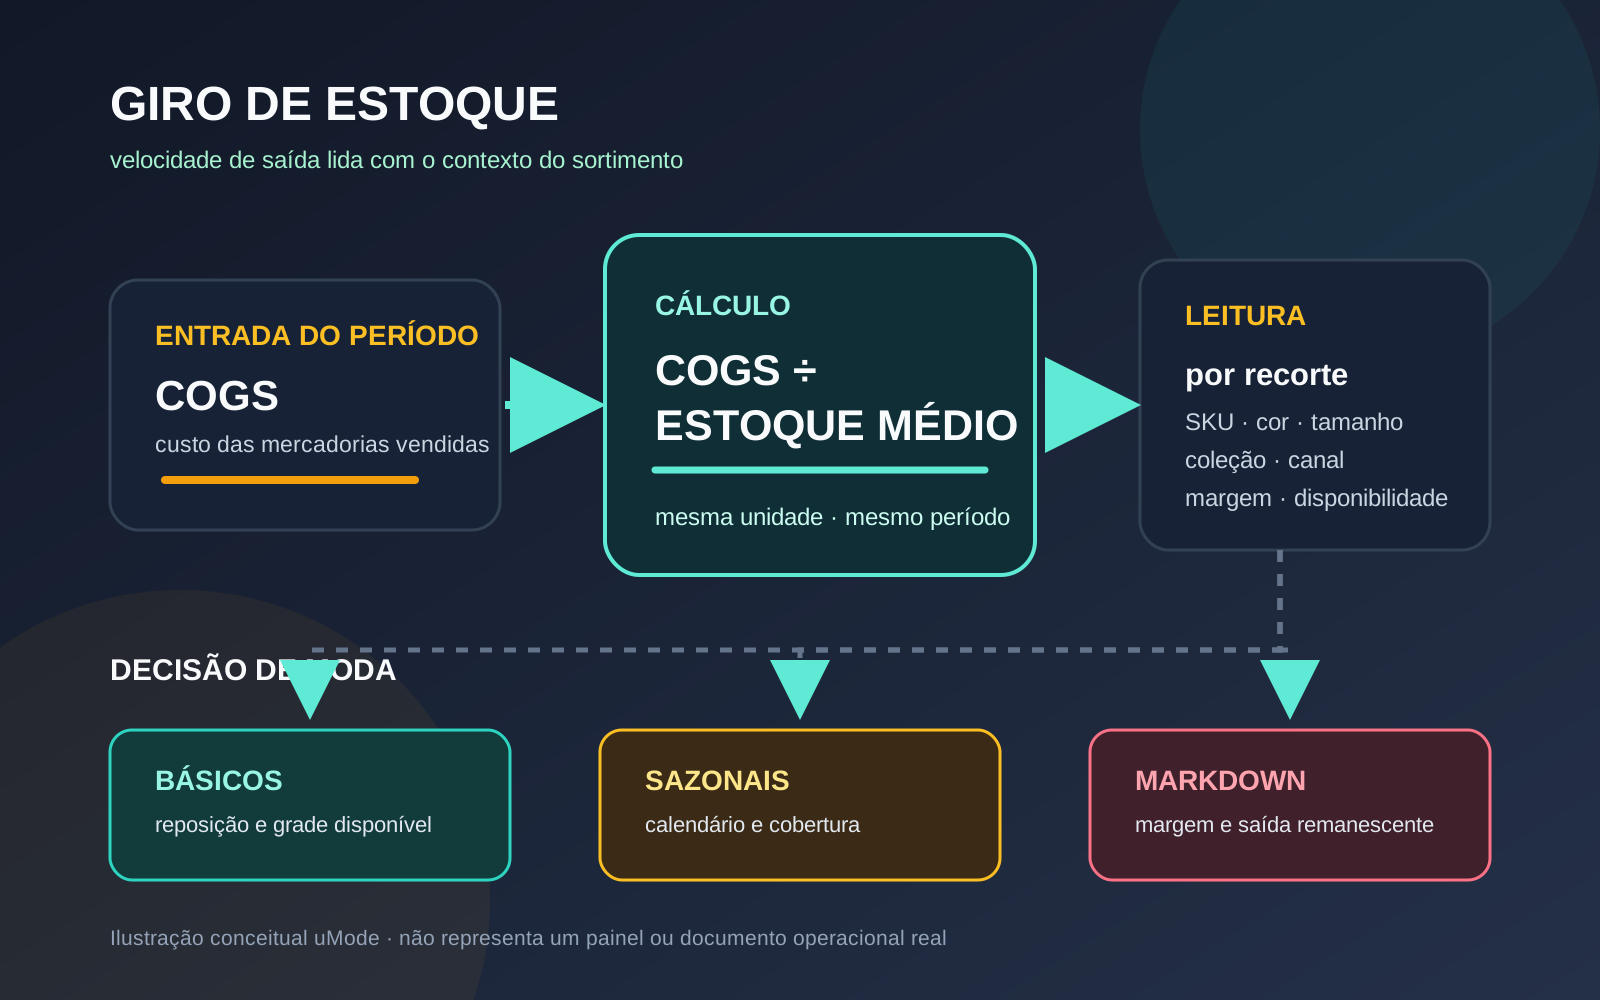
Inventory turnover is the ratio of cost of goods sold to average inventory over a defined period. In fashion retail, it must be read by product, collection, and channel alongside availability, margin, coverage, and markdowns, because speed of movement does not explain assortment quality on its own.
Sources
Want to apply this to your operation?